Introduction
The global brand intelligence market is expanding at a compound annual rate of 19.4%, with companies deploying structured research frameworks to secure measurable advantages across 70+ competitive verticals. Competitive Intelligence for Brand Market Research has become the operational backbone for businesses targeting sustainable market share growth, informed by over 98,000 product-level data points across 12 major retail ecosystems.
Through systematic data modeling and Web Scraping Services, organizations build precision market maps that accelerate revenue performance by up to 22.6% within a single fiscal quarter. Consumer preference shifts, pricing volatility, and multi-platform brand competition have reshaped how businesses evaluate opportunity across 60+ consumer categories valued at $53.8 billion annually.
Brands that integrate Web Scraping for Market Research into their planning cycles are processing 1.9 million competitive signals daily, enabling product strategy decisions with 93.2% confidence accuracy. This research outlines the core methodology, key performance outcomes, and actionable intelligence frameworks that allow brands to close competitive gaps and expand their market footprint across 18 targeted regional segments.
Methodology
1. Research Design and Data Sourcing
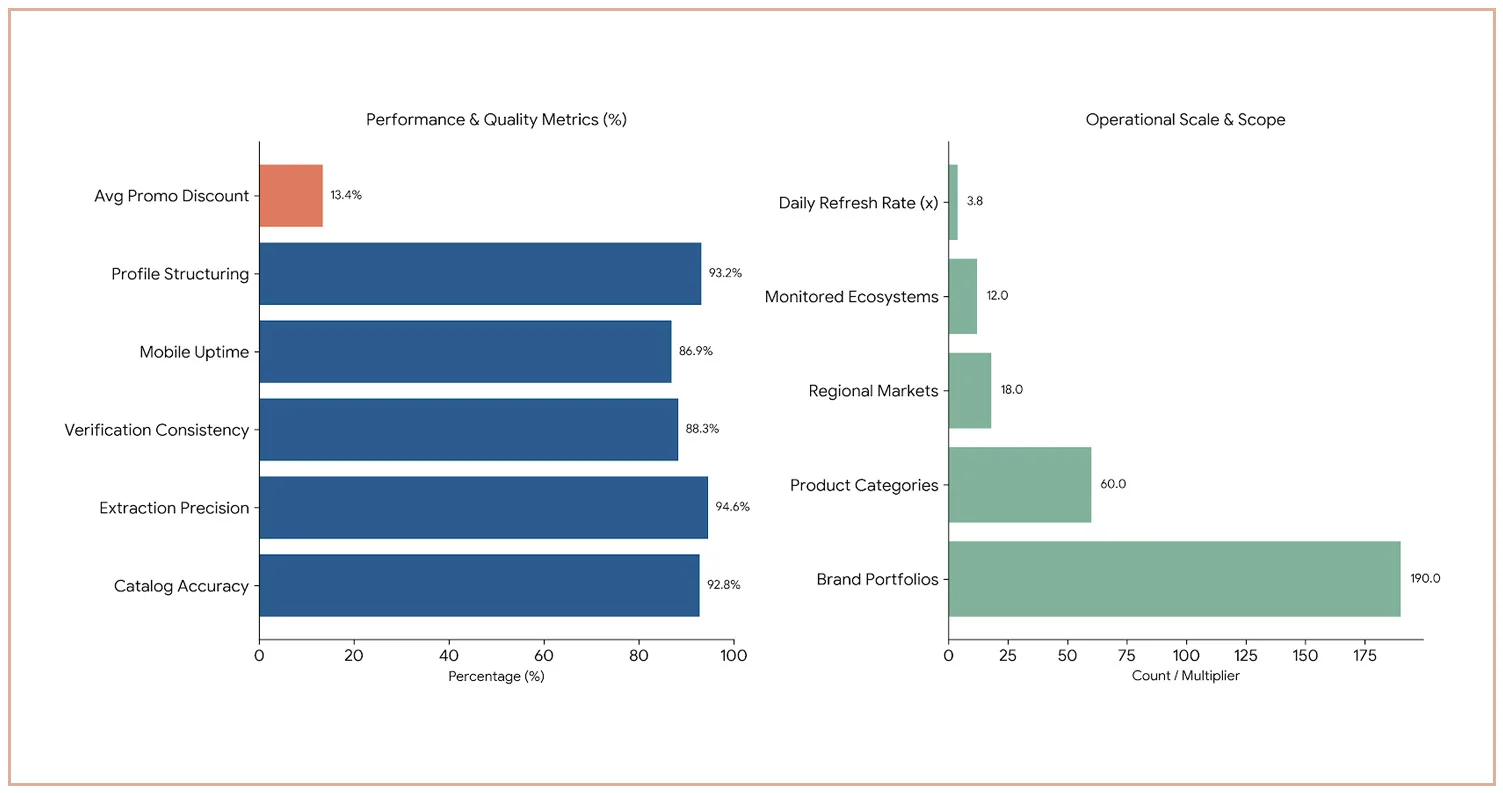
- Brand Landscape Profiling: Comprehensive mapping of 60+ product categories across 190 brand portfolios, capturing pricing structures, assortment depth, and promotional cadence with 92.8% catalog accuracy across 18 regional markets.
- Automated Signal Harvesting: High-frequency crawling architecture processes 1.9 million competitive data points daily, targeting brand-level pricing, product visibility, and availability signals with 94.6% extraction precision.
- Source Verification Framework: Cross-validation protocols referencing 2,100+ brand and retailer data feeds confirm intelligence reliability, achieving an 88.3% verification consistency score across all monitored categories.
2. Technical Architecture
- Custom Extraction Pipelines: Python-based frameworks incorporating Scrapy, Selenium, and Pandas manage 38,000+ active brand SKUs, purpose-built for multi-platform digital environments with dynamic content rendering across 18 market zones.
- Mobile and App Platform Coverage: Competitor Data Collection Services for Brands engineered for iOS and Android retail applications enable real-time product intelligence capture with 86.9% platform uptime across 12 monitored ecosystems.
- Distributed Processing Infrastructure: Scalable parallel processing pipelines handle 98,000+ brand product entries, supporting continuous competitive intelligence feeds refreshed at 3.8x daily intervals.
3. Information Collection Specifications
- Brand Product Attributes: Structured records spanning 60 product categories, 2,100+ active brand partnerships, variant-level packaging data, and ingredient transparency metrics enabling 93.2% complete brand profile structuring.
- Pricing Signal Layers: Granular price intelligence for 38,000+ brand SKUs capturing promotional discounts averaging 13.4%, bundle pricing variations, and real-time markdown events across 190 monitored brand portfolios, enabling Real-Time Competitor Price Monitoring at scale.
- Consumer Sentiment Data: Structured analysis of 940,000+ brand reviews, tracking rating trajectories and repurchase behavior patterns among 2.9 million active consumer accounts, supported by Web Scraping for Competitive Market Intelligence frameworks extracting multi-platform feedback signals.
Key Findings and Research Results
This research evaluates brand-level market performance and competitive positioning across diverse consumer categories, using Web Scraping AI to identify relevant market signals.
Structured data outcomes processing 98,000+ brand product records are detailed below:
| Performance Metric | Figure |
|---|---|
| Brand SKU Database | 98,000+ |
| Product Categories Monitored | 60 |
| Brand Portfolios Analyzed | 190 |
| Data Accuracy Rate | 94.6% |
| Daily Processing Volume | 1.9M records |
| Weekly Refresh Rate | 7.6x |
| Regional Market Coverage | 18 states |
| Consumer Profiles Analyzed | 2.9M |
Brand Portfolio and Inventory Signal Analysis
1. Assortment Intelligence Overview
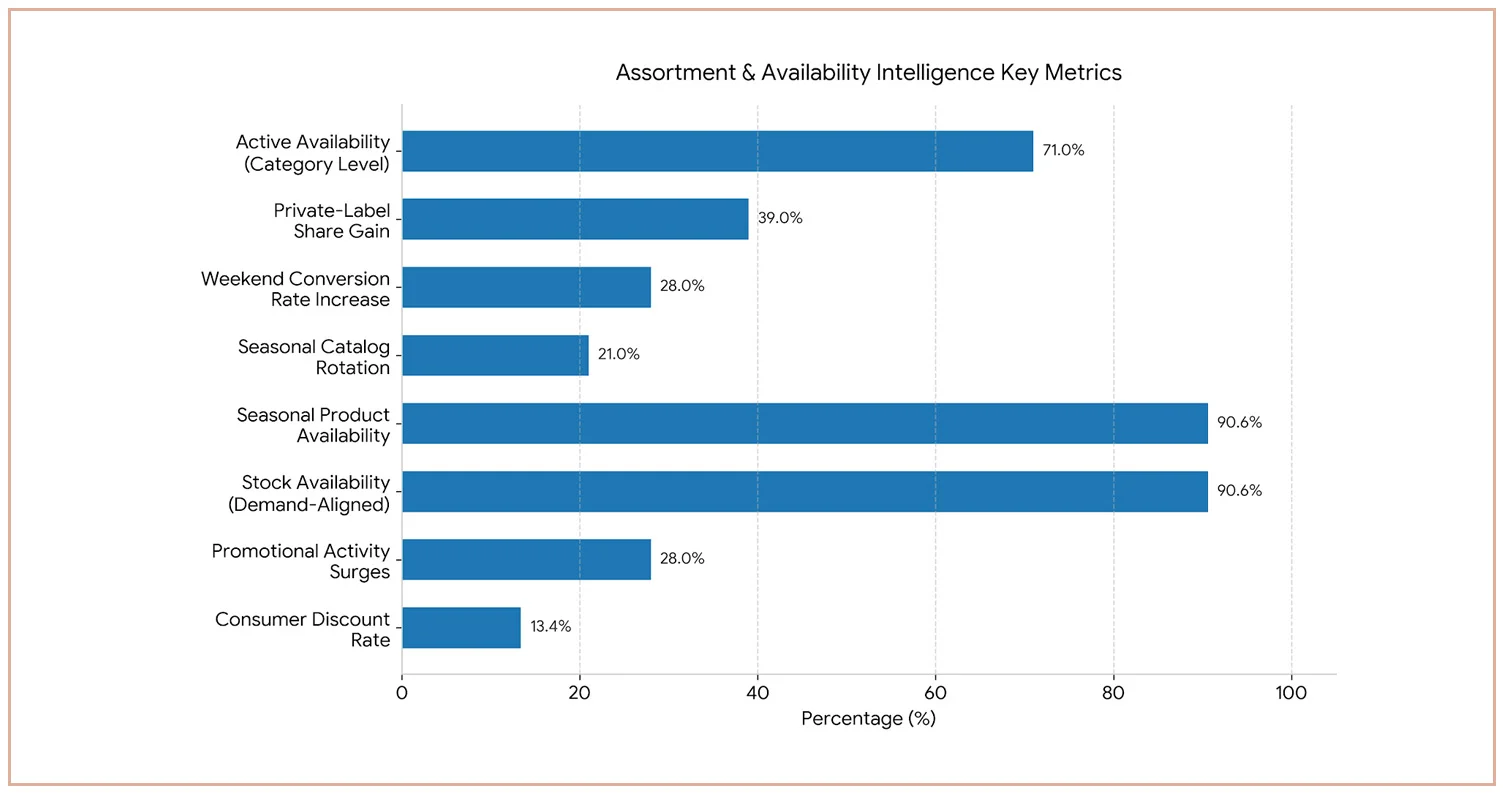
- Category-Level Performance Mapping: Brand assortments maintain 71% active availability across 60 monitored categories, contributing $3.1B in tracked quarterly brand revenue through optimized product-line positioning during high-demand retail windows.
- Private and Premium Label Growth: Brand acquisition strategies show a 39% private-label share gain, with weekend conversion rates rising 28% through structured extraction using Competitor Data Collection Services for Brands across 190 active portfolios.
- Seasonal Assortment Cycling: Intelligence data reveals 21% catalog rotation across seasonal product windows, with brand-level optimization achieving 90.6% product availability and 11.4x inventory turnover for elevated consumer satisfaction scores.
2. Product Availability Signal Intelligence
Analysis of 38,000+ brand SKUs through Web Scraping for Market Research frameworks revealed:
- Demand-Aligned Inventory Models: Integrated demand forecasting algorithms aligned with 2.9M consumer behavior signals achieved 90.6% brand stock availability and measurably improved customer retention rates across 18 regional segments.
- Adaptive Catalog Engine: Real-time assortment adjustments addressed 21% seasonal product rotations, 28% promotional activity surges, and regional preference divergences with 3.8x daily refresh rates across all monitored markets.
- Tiered Pricing Intelligence: Brand-specific cost positioning frameworks across 60 categories incorporated supplier agreements and competitive benchmarks, delivering average consumer discount rates of 13.4% across monitored SKUs.
Brand Intelligence Data Summary
Comprehensive evaluation of brand-level competitive performance indicators was executed across 60 major product categories to support strategic market intelligence development.
| Intelligence Metric | Figure |
|---|---|
| Active Brand SKUs | 38,000+ |
| Retailer Network Covered | 190 portals |
| Regional Market Reach | 18 states |
| Daily Processing Capacity | 1.9M records |
| Consumer Profiles Tracked | 2.9M accounts |
| Category Segments Monitored | 60 |
| Brand Partnerships Analyzed | 2,100+ vendors |
| Data Refresh Frequency | 3.8x daily |
| Intelligence Accuracy Rate | 94.6% |
| Annual Inventory Turnover | 11.4x |
| Price Signal Update Rate | 11.2x daily |
| Seasonal SKU Variation | 21% catalog |
| Weekend Conversion Boost | 28% increase |
| Average Consumer Discount | 13.4% |
| Product Availability Rate | 90.6% |
Operational Performance Intelligence
Systematic evaluation of core brand intelligence efficiency benchmarks was conducted across 60 major product categories to deliver structured performance insights from 98,000+ brand product records.
| Efficiency Benchmark | Figure |
|---|---|
| Daily Data Processing Volume | 1.9M records |
| Intelligence Synchronization Rate | 94.6% |
| Inventory Signal Refresh Cycle | 3.8x daily |
| Brand Performance Index Score | 74.8% |
| Market Penetration Coverage | 66.4% |
Strategic Market Intelligence
1. Brand Catalog Optimization Strategies
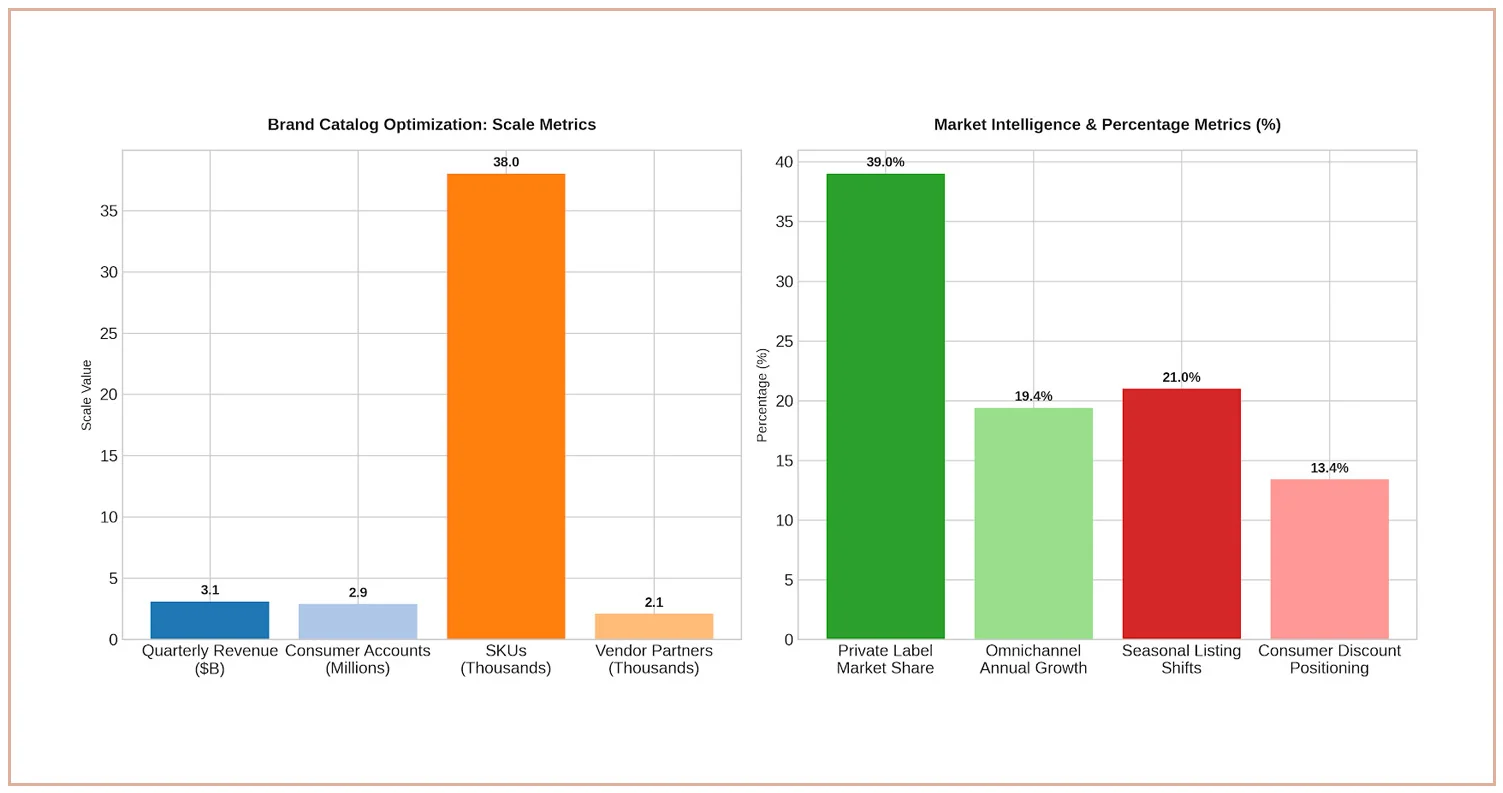
- Intelligence-Led Assortment Planning: Demand-driven evaluation of 60 product categories using behavioral signals from 2.9 million consumer accounts drives $3.1 billion in tracked quarterly brand revenue, guiding product line decisions and alliance strategies with 2,100+ vendor partners.
- Adaptive Brand-Level SKU Updates: Dynamic product intelligence frameworks leveraging Real-Time Competitor Price Monitoring across 38,000+ SKUs reflect 21% seasonal listing shifts, 3.8x daily refresh cycles, and integrated consumer behavioral analytics across 18 monitored regions.
- Competitive Benchmarking Operations: Structured brand and price analysis across 60 categories, quantifying 13.4% consumer discount positioning and enabling strategic brand alignment against primary market competitors across 18 U.S. states.
2. Market Intelligence Framework
- Direct Brand Competitors: Major wholesale and specialty retail players maintain 55–88 monitored categories and serve 20–45 million active consumers through differentiated brand value strategies and targeted promotional frameworks.
- Omnichannel Retail Convergence: As traditional retail ecosystems integrate digital-first brand strategies, opportunities through Web Scraping for Competitive Market Intelligence emerge to support cross-channel brand positioning across hybrid markets growing 19.4% annually across 18 key regions.
- Private Label Momentum: House brand portfolios hold a growing 39% market share, aligning product development with shifting consumer demographics and satisfaction benchmarks across 2.9 million tracked consumer profiles through App Data Scraping Services.
Impact of Data Collection on Brand Market Strategy
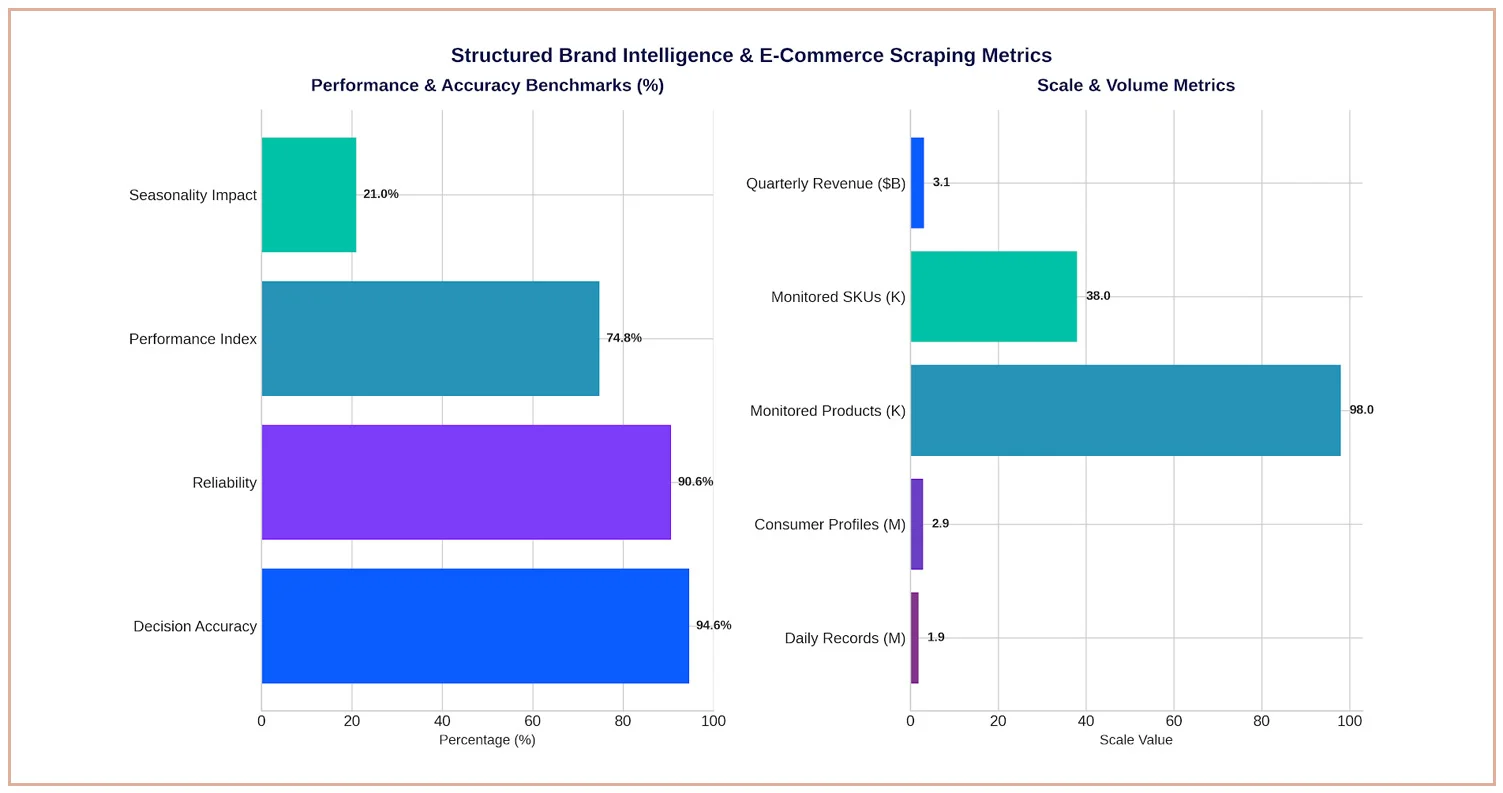
Processing 1.9 million records daily, structured brand intelligence fundamentally reshapes how companies approach portfolio management and competitive positioning across 60 product categories.
Systematic brand catalog analysis of 98,000+ products enables businesses to:
- Identify strategic assortment gaps by tracking competitive signals across 60 segments, achieving 74.8% performance index scores across 18 targeted regional markets.
- Forecast brand inventory positioning by evaluating demand patterns for 38,000+ SKUs and seasonal variations impacting 21% of monitored catalogs, with 11.4x annual turnover benchmarks.
- Strengthen partner and vendor relationships across 2,100+ brand networks by reviewing category-specific performance outcomes, driving $3.1 billion in tracked quarterly brand revenue.
- Enhance decision workflows using brand intelligence with 94.6% accuracy, shaped by behavioral signals from 2.9 million consumer profiles across multiple competitive segments.
E-Commerce App Scraping Services sustain long-term brand competitiveness through high-frequency market tracking at 3.8x daily update cycles and structured strategic signals, enabling confident decisions with a 90.6% reliability benchmark.
Conclusion
Sustained brand market expansion in today's $53.8 billion competitive landscape requires more than periodic research cycles; it demands continuous, precision-grade intelligence infrastructure operating across every active product category and regional market. Competitive Intelligence for Brand Market Research equips growing brands with the structured data frameworks needed to close competitive gaps, optimize assortment strategies, and convert market signals into measurable revenue outcomes.
Contact Mobile App Scraping today to build a custom intelligence framework tailored to your brand's competitive priorities. Through Real-Time Competitor Price Monitoring capabilities processing 1.9 million daily records, your brand can identify pricing opportunities, track competitor moves, and act decisively across 60 monitored categories with 94.6% accuracy.