How Can Competitor Menu Price Scraping for Food Delivery Platforms Decode Demand and ETA Trends?
Introduction
Food delivery platforms continuously change menu prices, item availability, promotions, delivery estimates, and restaurant offerings. Monitoring these shifts manually can make competitive analysis slow and inconsistent. Food Delivery App Scraping Services help businesses collect structured information across multiple platforms and locations for timely market evaluation.
Price movements often reflect changes in demand, promotions, restaurant capacity, and local competition. By tracking these variables together, businesses can identify recurring patterns rather than viewing pricing as an isolated metric. Competitor Menu Price Scraping for Food Delivery Platforms provides a structured way to compare menu-level changes and delivery conditions.
The resulting data can support restaurant benchmarking, demand analysis, operational planning, and ETA evaluation. Businesses can monitor competitor behavior at defined intervals, organize historical records, and compare market conditions across locations. This creates a stronger foundation for understanding how pricing and delivery performance influence customer choices.
Strategic Signals Behind Competitor Menu Pricing And Demand Shifts
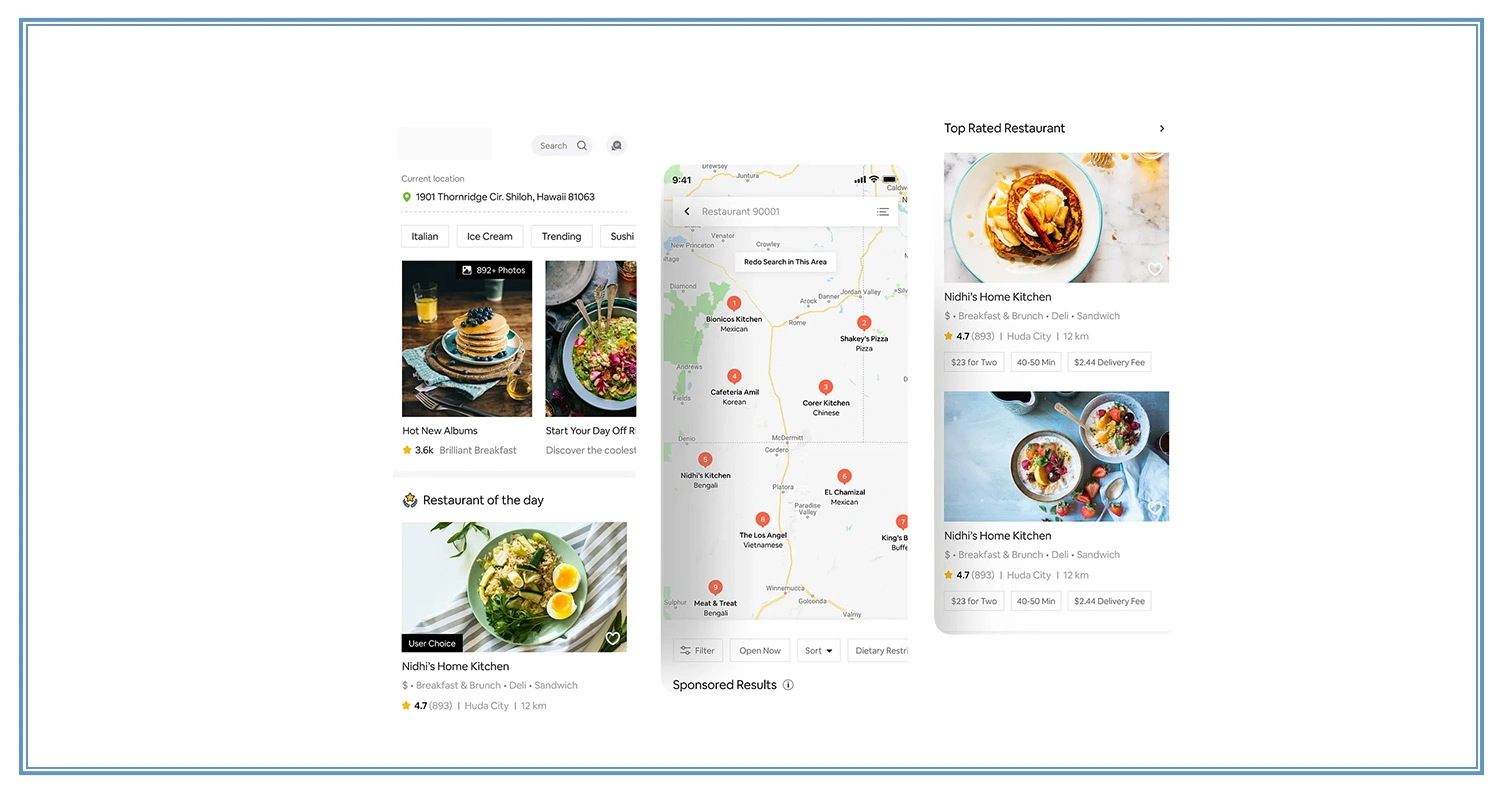
Competitor menu prices can change several times throughout the day because of promotions, local demand, restaurant availability, and operating conditions. Businesses therefore need consistent observations rather than occasional manual checks. Web Scraping Menu Price Data for Food Delivery Platforms can help organize pricing information across restaurants, locations, categories, and time periods, making market comparisons more structured and easier to analyze.
Pricing information becomes more valuable when it is connected with broader competitive signals. Businesses can compare regular prices, discounted prices, delivery charges, item availability, and promotional changes to understand how restaurants respond to market conditions. With Competitive Benchmarking Services incorporated into the analysis process, teams can establish comparable benchmarks and identify meaningful differences between competing restaurants without relying on isolated observations.
| Data Category | Analytical Purpose |
|---|---|
| Menu Prices | Compare restaurant pricing |
| Discounts | Identify promotional activity |
| Item Availability | Monitor supply changes |
| Delivery Charges | Evaluate customer costs |
Several practical indicators can be monitored continuously to create a more complete competitive picture. These include:
- Restaurant-level price movements
- Category-wise pricing differences
- Discount frequency and duration
- Changes in item availability
- Location-specific market variations
Historical records also make it easier to identify recurring patterns rather than focusing only on current prices. When businesses Extract Restaurant Menu Data for Pricing, Availability, and Demand Insights, they can compare pricing movements with product availability and changing market conditions.
This broader perspective can help analysts understand whether a price adjustment appears alongside promotional activity, limited availability, or increased competition. Such structured observations provide useful inputs for market research, pricing reviews, and competitive strategy development.
Emerging Patterns Connecting Menu Changes With Food Delivery Demand
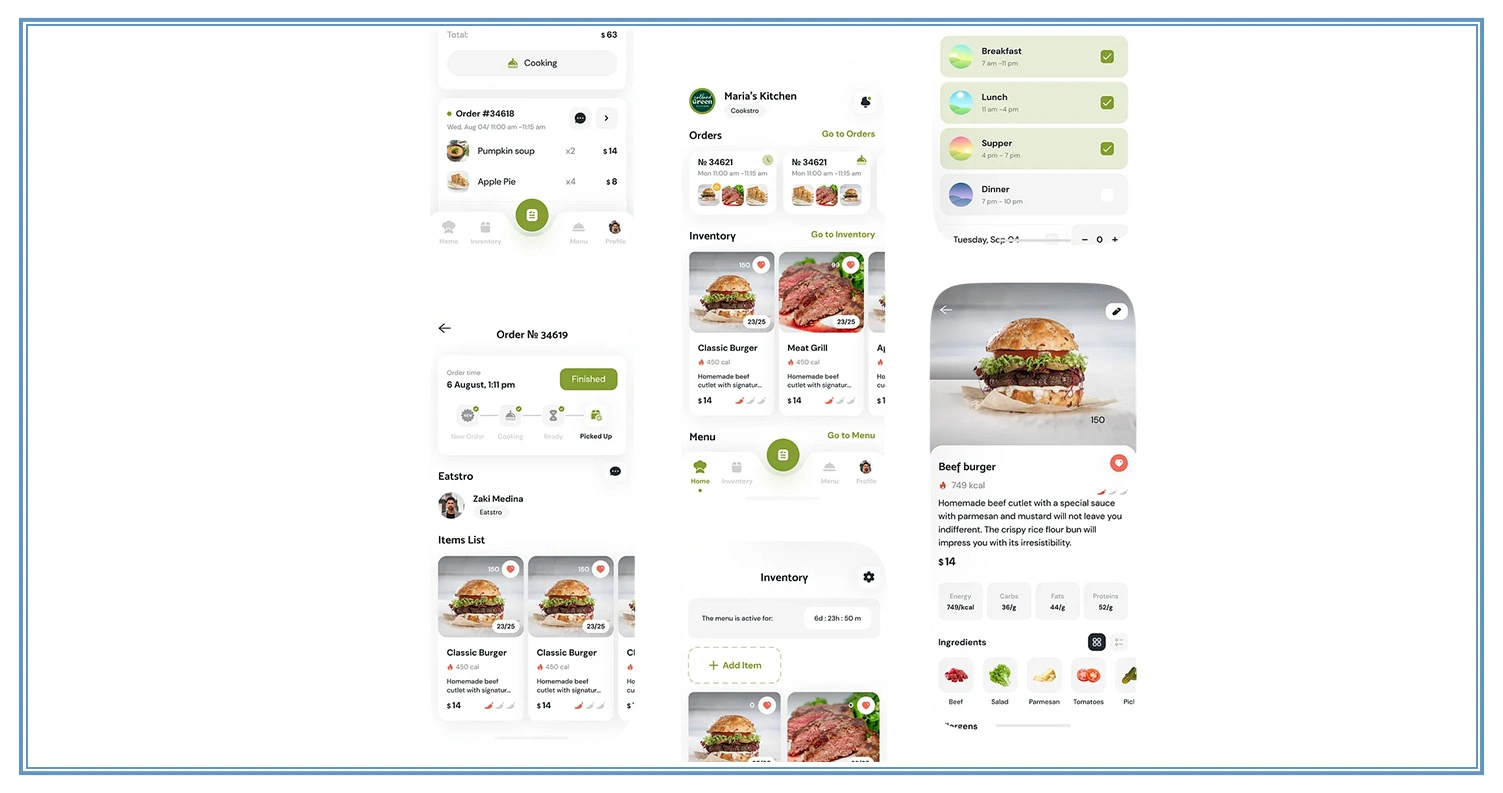
Menu availability provides important context for understanding changing demand across food delivery markets. Popular items may become unavailable during busy periods, while restaurants can introduce temporary promotions to encourage orders during slower periods. Food Delivery Datasets can preserve these changing observations over time, allowing businesses to compare historical menu conditions with pricing movements, restaurant activity, and location-specific trends.
A consistent dataset can reveal patterns that are difficult to identify through one-time observations. For example, businesses may find that certain categories experience repeated availability changes during specific hours or that promotional pricing appears more frequently around expected demand peaks. Food Delivery Data Scraping for Demand Forecasting and Market Research can organize these observations into structured historical records that support demand analysis and market comparisons across multiple restaurants and geographic areas.
| Variable | Potential Business Insight |
|---|---|
| Item Availability | Supply conditions |
| Menu Changes | Product strategy |
| Ordering Period | Demand timing |
| Restaurant Location | Local market behavior |
Businesses can monitor several useful indicators to strengthen their analysis:
- Frequently unavailable menu items
- Changes in restaurant offerings
- Price movements around peak periods
- Category-level availability patterns
- Location-based ordering conditions
Combining menu information with historical observations can provide greater context for demand interpretation. When businesses monitor changes over repeated periods, they can distinguish temporary fluctuations from recurring market behavior. This approach also supports comparisons between restaurants operating in similar locations or categories.
Rather than treating menu availability as a standalone metric, analysts can evaluate it alongside prices, promotions, and delivery conditions to build a clearer picture of customer demand and restaurant operating patterns.
Advanced Insights Linking Delivery Times With Competitive Market Conditions

Estimated delivery times can change because of several operational and market factors, including order volume, restaurant workload, courier availability, distance, traffic, and weather conditions. Monitoring these changes alongside competitor activity can provide useful context for understanding service performance. Dynamic Pricing Solutions can incorporate relevant market observations when businesses evaluate how changing demand and operating conditions may influence customer-facing prices.
ETA information becomes particularly valuable when collected consistently across different locations and time periods. Businesses can compare estimated delivery times during peak and off-peak periods, examine differences between restaurants, and identify recurring variations. This structured approach helps teams understand whether longer ETAs coincide with pricing changes, limited menu availability, or periods of increased customer activity.
| ETA Factor | Business Relevance |
|---|---|
| Delivery Estimate | Service evaluation |
| Distance | Route complexity |
| Peak Period | Demand pressure |
| Restaurant Capacity | Fulfillment conditions |
Useful monitoring activities can include:
- Recording ETA changes at regular intervals
- Comparing peak and off-peak delivery estimates
- Tracking restaurant-level service variations
- Reviewing location-based ETA differences
- Comparing delivery conditions with menu changes
Real-time observations can strengthen operational analysis when they are combined with historical records. Businesses can Scrape Food Delivery Data for Real-Time ETA Analytics to examine delivery estimates alongside menu, pricing, and availability conditions.
This creates a more connected view of market behavior and helps analysts identify recurring relationships between customer-facing delivery times and competitive activity. Such information can support operational planning, service evaluation, pricing analysis, and broader food delivery market research without treating ETA as an isolated performance measure.
How Mobile App Scraping Can Help You?
Mobile applications contain frequently changing information that can be difficult to monitor through manual methods. Competitor Menu Price Scraping for Food Delivery Platforms can collect structured menu, pricing, availability, and delivery information at scheduled intervals, helping businesses maintain consistent competitive records.
Key capabilities can include:
- Automated collection from multiple food delivery applications
- Scheduled monitoring of changing menu information
- Structured extraction of restaurant-level pricing details
- Location-based comparison of delivery conditions
- Historical storage for trend and performance analysis
- Integration of collected information with business analytics systems
With consistent collection, businesses can compare current observations with historical records and identify meaningful changes across markets. The resulting information can support operational teams, analysts, restaurant groups, and technology providers. Scrape Food Delivery Data for Real-Time ETA Analytics can further connect delivery-time observations with changing market conditions, giving teams a clearer view of service patterns and potential demand pressure.
Conclusion
Food delivery markets change rapidly as restaurants adjust prices, menus, promotions, availability, and delivery conditions. Competitor Menu Price Scraping for Food Delivery Platforms brings these changing signals into a structured analytical workflow, allowing businesses to compare market activity and identify recurring relationships between pricing, demand, and ETA performance.
Consistent monitoring can make competitive research more timely and practical, particularly across multiple restaurants and locations. Real-Time Menu Price Monitoring Across Food Delivery Platforms can support ongoing comparisons and historical analysis. Contact Mobile App Scraping to build a reliable food delivery data collection strategy tailored to your competitive research and analytics requirements.