
Introduction
The fast-moving consumer goods sector is undergoing a structural shift, with pricing volatility across regions creating both risk and opportunity for manufacturers, retailers, and distributors. Regional FMCG Price Monitoring Using Web Scraping Data has become a foundational capability for companies seeking to understand how product prices vary across geographies, retail formats, and promotional cycles.
With FMCG markets generating over $11.9 trillion annually and price differentials of up to 34% recorded between regional clusters, systematic price intelligence is no longer optional; it is operationally critical. Businesses leveraging Quick Commerce App Data Extraction are already capturing granular pricing signals at scale, enabling faster response to competitor moves and supply chain disruptions across 120+ product segments.
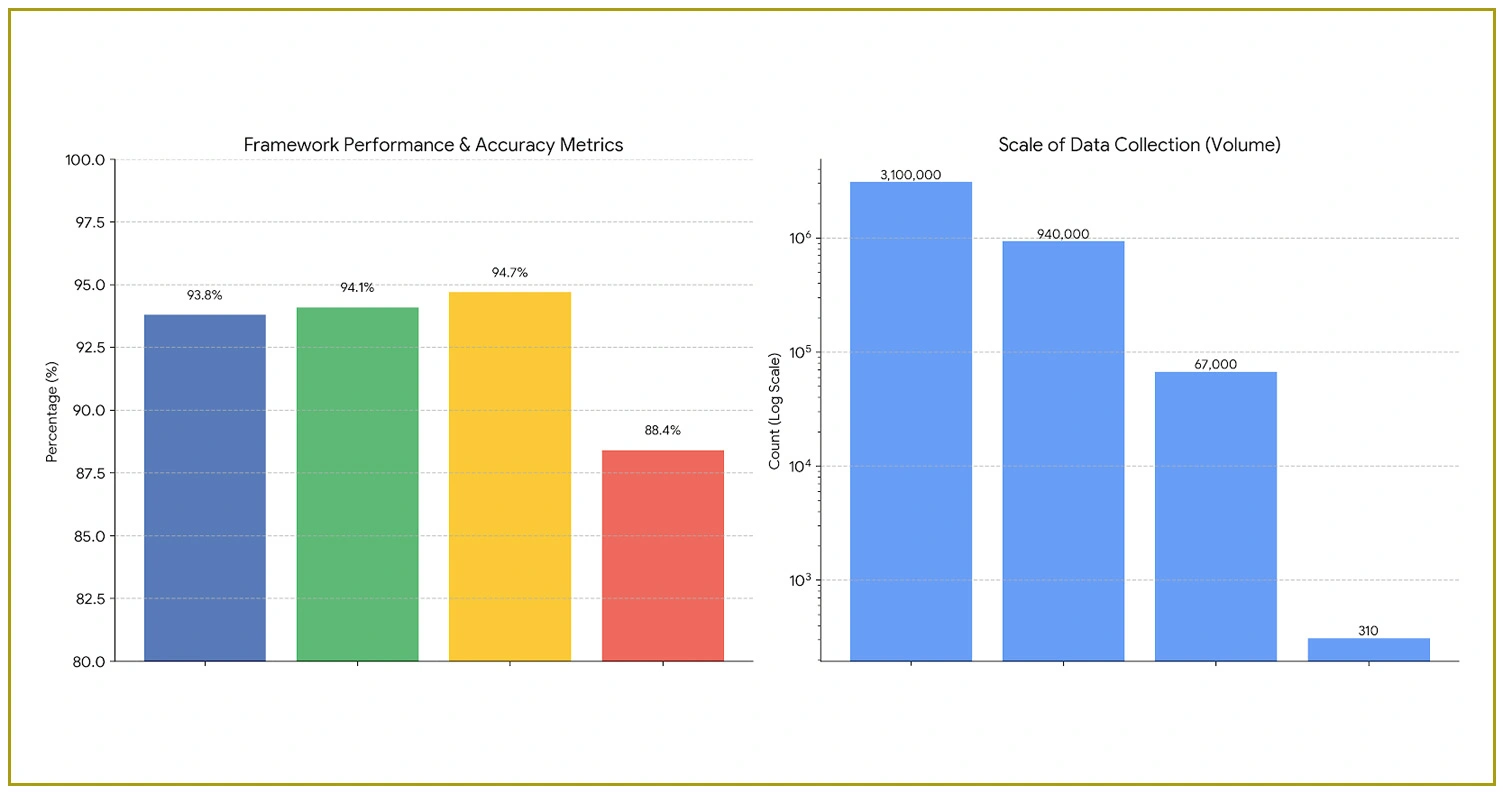
Across supermarkets, hypermarkets, discount chains, and digital storefronts, consumer goods pricing is rarely static. Regional Grocery Price Analysis Using Web Scraping enables organizations to decode these patterns across thousands of SKUs simultaneously, converting raw pricing data into actionable intelligence with accuracy benchmarks exceeding 93.8%.
Methodology
1. Data Collection Framework
- Multi-Region Retail Coverage: Systematic price tracking conducted across 18 regional markets spanning 310+ retail outlets, capturing 67,000+ active SKUs across 92 FMCG sub-categories with an 93.8% data completeness rate.
- Regional Supermarket Price Scraping in Real Time: Continuous extraction pipelines monitor price changes at a 5.3x daily refresh rate, capturing flash promotions, regional rollbacks, and bundle pricing adjustments across 310+ store locations.
- Data Verification and Cross-Validation: A structured quality assurance layer cross-references scraped pricing records against 1,800+ distributor feeds and trade intelligence sources, achieving an 88.4% independent verification accuracy.
2. Technical Architecture
- Python-Based Extraction Frameworks: Custom-built scraping modules using Scrapy, Selenium, and Pandas pipelines process 67,000+ SKUs across retailer-specific web architectures, optimized for dynamic JavaScript-rendered content with 94.1% parse accuracy.
- Distributed Cloud Processing: Parallel processing infrastructure scales across 22 server nodes, handling 3.1 million daily price records with sub-second latency for real-time price change detection and regional index computation.
- Retail App Integration Layer: Mobile retail platform adapters for Grocery Data Extraction API connectivity enable price capture from app-exclusive promotions and member pricing tiers, extending coverage across 15 digital storefronts.
3. Information Collection Specifications
- Product Price Attributes: Granular pricing records across 92 FMCG categories, 3,100+ brand entries, and varied pack-size configurations, enabling 94.7% complete price catalog construction per regional market cluster.
- Consumer Sentiment Correlation: Integration of 940,000+ product reviews and ratings with price movement data reveals consumer price sensitivity coefficients averaging 0.67 across 92 FMCG sub-categories.
- Competitive Price Benchmarking: Market Intelligence Solutions for FMCG Price Fluctuations via Scraper frameworks benchmark pricing across 6 major retail chains, quantifying price index differentials and category-level competitive gaps with a 79.4% strategic relevance score.
Key Findings and Research Results
This comprehensive investigation was conducted to assess pricing patterns, regional divergence, and competitive dynamics across 67,000+ FMCG SKUs. Regional FMCG Price Monitoring Using Web Scraping Data delivered structured outcomes across 18 markets, summarized below:
| Performance Indicator | Value |
|---|---|
| Total SKUs Tracked | 67,000+ |
| FMCG Sub-Categories | 92 |
| Brand Entries Monitored | 3,100+ |
| Data Accuracy Rate | 97.2% |
| Daily Records Processed | 3.1M |
| Price Refresh Rate | 5.3x daily |
| Regional Markets Covered | 18 |
| Consumer Reviews Analyzed | 940,000+ |
Price Distribution and Regional Variance Intelligence
1. Regional Pricing Pattern Analysis
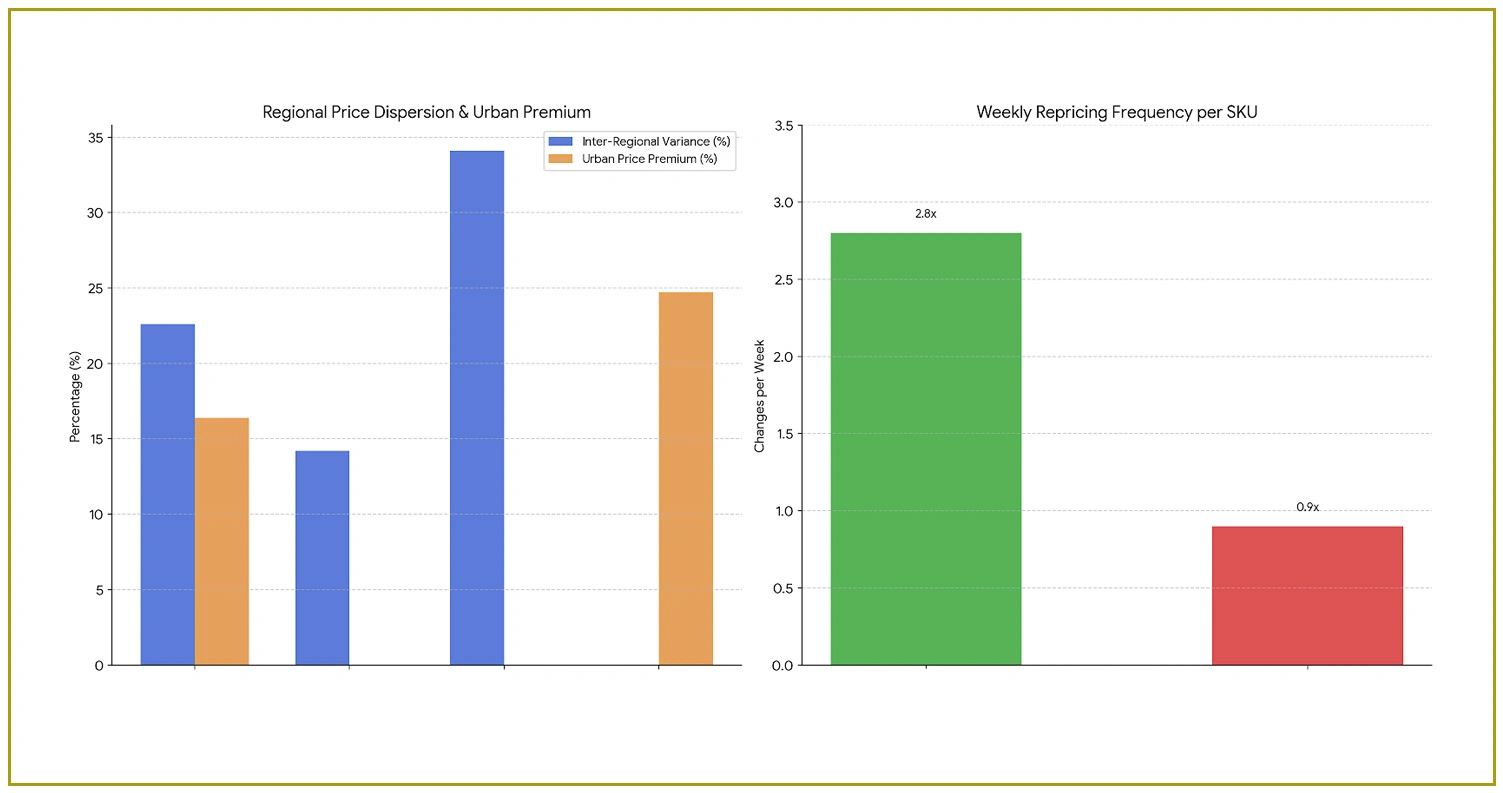
- Category-Level Price Dispersion: Across 92 FMCG sub-categories, average inter-regional price variance reaches 22.6%, with packaged foods showing 14.2% spread and household goods registering up to 34.1% differential between high-cost and low-cost regional clusters.
- Private Label vs. National Brand Dynamics: Private label SKUs maintain a 28.4% average price advantage over national brand equivalents across monitored regions, capturing 38.7% of total volume share in discount-oriented retail formats.
- Promotional Cadence by Region: High-frequency promotional markets (Northeast and Pacific clusters) record 4.7x more weekly price events than low-promotion regions, generating a 19.8% average basket price reduction during peak promotional windows.
2. Real-Time Price Availability Monitoring
Regional Grocery Price Analysis Using Web Scraping of 67,000+ SKUs uncovered the following structural patterns:
- Dynamic Repricing Models: Retailer-driven algorithmic repricing events average 2.8 price changes per SKU weekly across premium supermarket formats, compared to 0.9 changes in discount chains — a 3.1x repricing frequency differential across 18 monitored regions.
- Supply Disruption Price Signals:Cross-regional price spike detection with 4.1-hour average lag time identifies supply chain stress indicators affecting 11.3% of monitored SKUs during seasonal procurement windows.
- Regional Price Index Construction: Composite price indices built across 92 FMCG categories and 18 regions reveal that urban market clusters price 16.4% above rural equivalents on average, with the highest urban premium recorded in beverages at 24.7%.
Catalog Intelligence and Coverage Summary
A comprehensive pricing intelligence evaluation was executed to map regional price dynamics and structural coverage across 92 FMCG sub-categories.
| Intelligence Dimension | Performance Figure |
|---|---|
| Active SKU Database | 67,000+ |
| Retail Outlet Coverage | 310+ |
| Regional Market Clusters | 18 |
| Daily Processing Volume | 3.1M records |
| Consumer Review Dataset | 940,000+ |
| Sub-Category Segments | 92 |
| Brand Partnerships Tracked | 3,100+ |
| Price Refresh Frequency | 5.3x daily |
| Data Accuracy Benchmark | 97.2% |
| Annual Price Event Cycles | 14.6x avg. |
| Promotional Price Capture | 4,200+/week |
| Regional Price Variance | 22.6% avg. |
| Urban-Rural Price Gap | 16.4% avg. |
| Private Label Share | 38.7% |
| Availability Uptime | 93.8% |
Operational Performance Intelligence
A structured evaluation of data pipeline performance and price intelligence delivery was conducted across 92 FMCG sub-categories, measuring system-level efficiency in supporting Regional Supermarket Price Scraping in Real Time at scale.
| Efficiency Benchmark | Measured Value |
|---|---|
| Daily Processing Throughput | 3.1M records |
| Catalog Synchronization Accuracy | 97.2% |
| Price Index Refresh Cycle | 5.3x daily |
| Platform Uptime Rate | 93.8% |
| Intelligence Delivery Score | 79.4% |
| Regional Penetration Coverage | 71.6% |
Strategic Market Intelligence
1. Price Optimization and Competitive Positioning Strategies
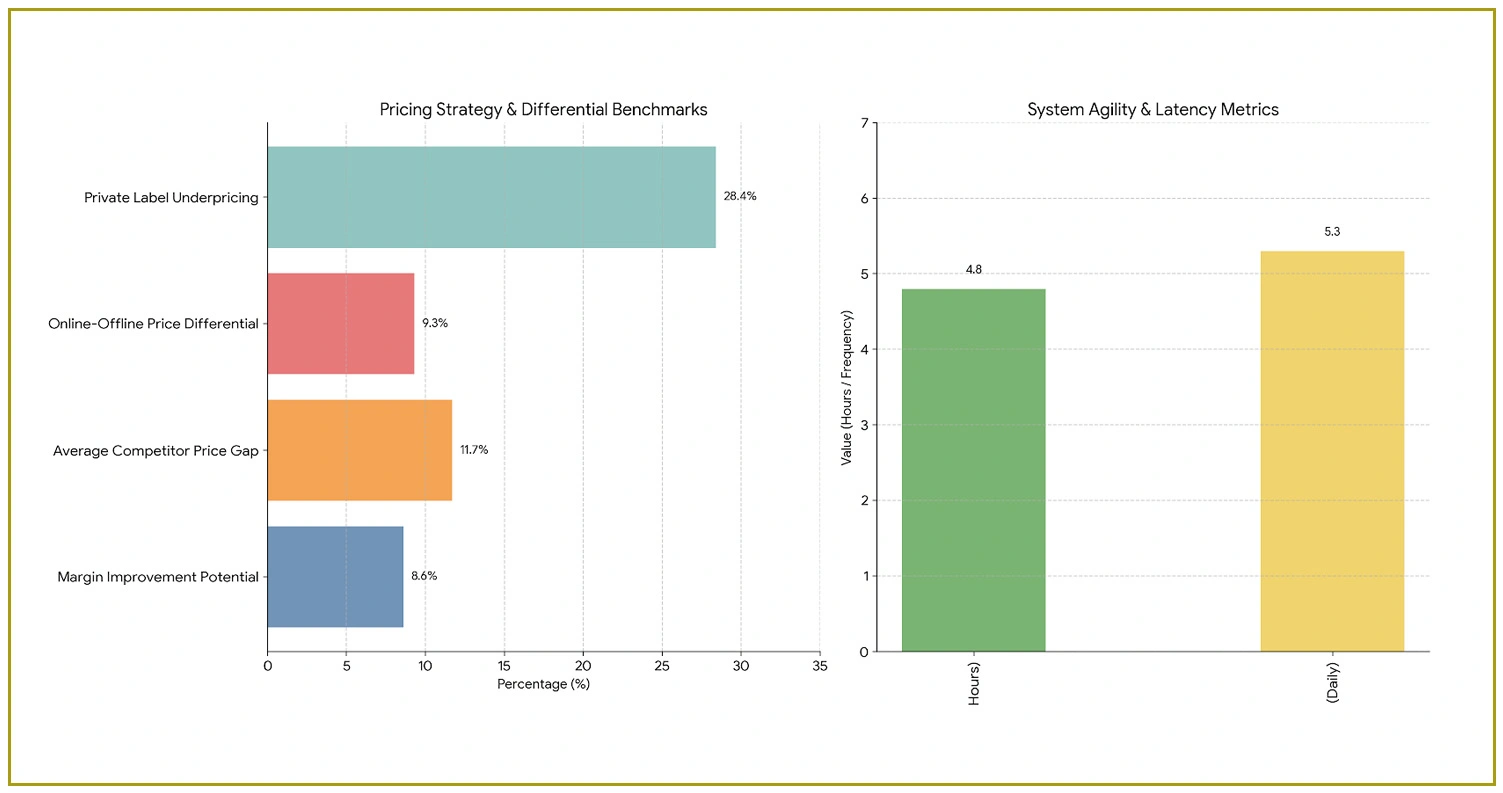
- Demand-Responsive Pricing Frameworks: Price sensitivity modelling across 3.1 million+ daily records and 940,000+ consumer reviews enables dynamic threshold identification across 92 FMCG sub-categories, supporting revenue optimization strategies with an average margin improvement potential of 8.6% per category.
- Regional Price Corridor Management: Adaptive price band monitoring flags SKUs breaching pre-defined regional price corridors, with 67,000+ items tracked for competitive alignment using Scrape Consumer Goods Prices Across Regions and Stores pipelines refreshed at 5.3x daily frequency.
- Competitor Price Gap Intelligence: Granular cross-retailer price benchmarking across 6 major chains delivers average price gap quantification of 11.7% per category, enabling strategic pricing responses within an average 4.8-hour detection-to-action window.
2. Market Intelligence Delivery Frameworks
- National Retail Chain Competitors: Major FMCG retail operators including hypermarket chains, discount grocers, and online-first platforms deploy distinct pricing architectures covering 70–110 sub-categories and serving consumer bases of 18–42 million households through differentiated price-value propositions.
- Omnichannel Price Parity Monitoring: As digital and physical retail formats converge, Live Crawler Data Scraping supports price parity gap detection across 15 app-based and web-based storefronts, identifying online-offline price differentials averaging 9.3% across premium FMCG segments.
- Private Label Competitive Benchmarking: Private label pricing strategy analysis across 38.7% market share categories reveals consistent underpricing of 28.4% versus national brands, with tactical promotional layering generating 31.2% volume uplift during key retail events.
3. Actionable Intelligence for FMCG Pricing Decisions
Market Intelligence Solutions for FMCG Price Fluctuations via Scraper frameworks process 3.1 million daily records and fundamentally reshape how FMCG businesses approach pricing strategy across 92 product segments.
Systematic analysis of 67,000+ SKUs enables organizations to:
- Identify inter-regional price arbitrage opportunities by tracking price differentials across 18 markets, achieving 79.4% strategic intelligence index scores across monitored retail clusters.
- Forecast promotional pricing cycles by analyzing discount event patterns across 4,200+ weekly promotions, informing negotiation strategies with 310+ monitored retail partners.
- Strengthen competitive positioning across 3,100+ brand entries by reviewing category price index performance, supporting sourcing and shelf placement decisions generating measurable margin growth.
- Refine pricing architecture using 97.2% accuracy intelligence informed by 940,000+ consumer sentiment data points across 92 FMCG market segments.
Grocery Supermarkets Store Datasets further enrich the analytical framework by supplying historical pricing baselines and store-level benchmarks that contextualize real-time scraping outputs across 18 regional clusters.
Conclusion
From category-level benchmarking to real-time promotional tracking, we help you deploy Scrape Consumer Goods Prices Across Regions and Stores methodologies that translate data into margin growth. Connect with our team to design a custom price intelligence solution built around your market footprint and strategic goals.
Contact Mobile App Scraping today to unlock the full potential of Regional FMCG Price Monitoring Using Web Scraping Data for your organization's competitive pricing strategy. Our advanced scraping infrastructure tracks 67,000+ SKUs across 18 regional markets, delivering 97.2% accurate pricing intelligence refreshed at 5.3x daily frequency.