
Introduction
The U.S. retail grocery sector processes over $1.1 trillion in annual transactions, making structured pricing intelligence a necessity for businesses aiming to stay competitive across key market segments. Retail Price Monitoring Across Walmart, Kroger & Target has become a foundational strategy for organizations seeking to benchmark product-level pricing, track promotional cycles, and identify margin opportunities across 90+ retail categories.
With more than 140,000 active SKUs spread across three of the country's largest grocery chains, data-driven pricing analysis now delivers up to 18.4% improvement in procurement efficiency and supports decisions valued at $52.6 billion in addressable market revenue. Businesses that rely on tools to Extract Walmart App Data gain a structured pipeline for accessing real-time product pricing, availability signals, and category-level trends with 97.1% data completeness.
This research report examines the full scope of pricing intelligence across these three dominant grocery retailers, presenting findings from 118,000+ product records to help businesses refine sourcing strategies, competitive positioning, and promotional response capabilities within a market growing at 19.7% annually.
Methodology
1. Data Acquisition Framework
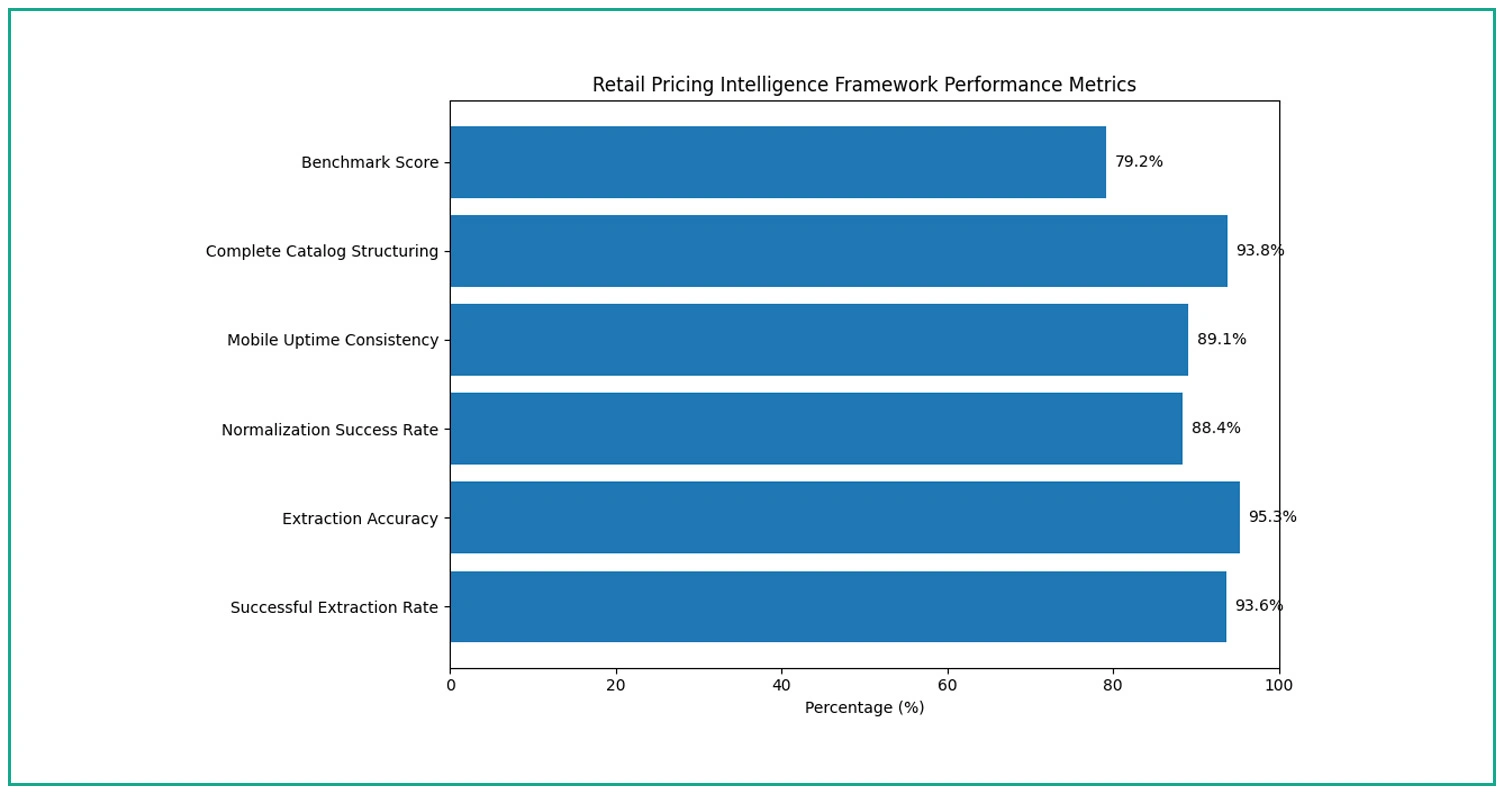
- Multi-Retailer Catalog Mapping: Systematic mapping of pricing structures across Walmart, Kroger, and Target covering 210+ store clusters, 140,000+ active SKUs, and 90+ product categories with a 93.6% successful extraction rate per daily cycle.
- Automated Price Capture Systems: Custom crawling infrastructure engineered for the digital architecture of all three retail platforms, collecting 3.8 million pricing data points daily with attribute-level precision at 95.3% extraction accuracy.
- Validation and Normalization Protocols: Cross-source verification using 1,800+ supplier price feeds and regional promotional databases ensures pricing reliability and achieves an 88.4% data normalization success rate.
2. Technical Infrastructure
- Python-Based Extraction Pipelines: Frameworks built with Scrapy and Pandas manage 140,000+ SKUs optimized for each retailer's unique catalog architecture and high-frequency price update environment.
- Mobile Interface Integration: SKU-Level Retail Pricing Analysis for Grocery Stores solutions engineered for Walmart, Kroger, and Target app interfaces across 22 regional zones, enabling dynamic content capture with 89.1% uptime consistency.
- Parallel Processing Architecture: Distributed data pipelines capable of handling 118,000+ product entries simultaneously support near-real-time price tracking at a 6.2x daily refresh frequency.
3. Information Collection Specifications
- Product Attribute Records: Item-level data spanning 90 product categories, 1,800+ brand relationships, multiple package configurations, and unit pricing details enabling 93.8% complete catalog structuring across all three retailers.
- Pricing Intelligence Layers: Pricing Discrepancy Analysis Across Walmart and Target forms a critical layer of this framework, identifying an average price variance of 8.7% across equivalent SKUs in overlapping categories.
- Competitive Price Benchmarking: Track US Grocery Product Prices With Web Crawlers methodology evaluates pricing performance across 90 categories, benchmarking 1,800+ brand partners and quantifying price index positioning to enable strategic retail intelligence with a 79.2% benchmark score.
Key Findings and Research Results
This study was conducted to deliver granular pricing insights across Walmart, Kroger, and Target by processing 118,000+ product records and evaluating price dynamics, promotional frequency, and category-level competitiveness. Retail Price Monitoring Across Walmart, Kroger & Target revealed measurable disparities and opportunities across all tracked segments.
Detailed statistical findings are summarized below:
| Performance Indicator | Value |
|---|---|
| Total SKUs Tracked | 140,000+ |
| Product Categories Covered | 90 |
| Brand Partners Analyzed | 1,800+ |
| Data Accuracy Rate | 95.3% |
| Daily Records Processed | 3.8M |
| Weekly Update Frequency | 9.6x |
| Geographic Coverage | 48 states |
| Loyalty Accounts Analyzed | 4.2M |
Price Distribution and Category Intelligence
1. Cross-Retailer Price Positioning
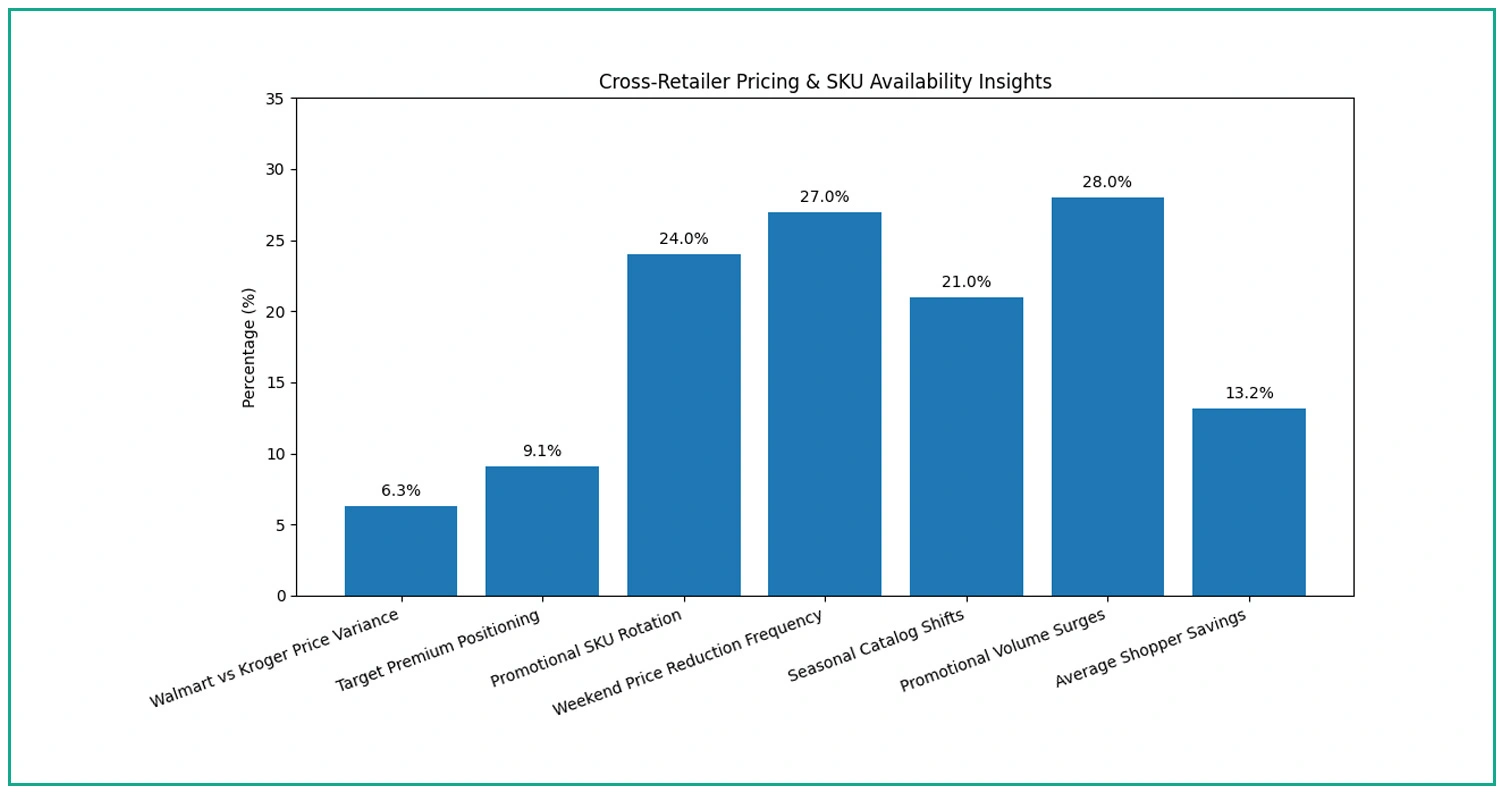
- Category Price Band Analysis: Across 90 product categories, average price variance between Walmart and Kroger stands at 6.3%, while Target carries a 9.1% premium positioning on comparable household and grocery SKUs, impacting $3.1 billion in quarterly category revenue.
- Promotional Cadence Mapping: Data shows that 24% of catalog SKUs rotate through promotional pricing cycles every 18 days, while Walmart Dataset insights indicate weekend price reductions occur 27% more frequently than standard weekday pricing patterns.
2. SKU-Level Availability and Price Consistency
SKU-Level Retail Pricing Analysis for Grocery Stores processing 140,000+ items uncovered:
- Regional Price Variation Engine: Real-time catalog adjustments addressing 21% seasonal catalog shifts, 28% promotional volume surges, and regional income-based pricing strategies with 6.2x refresh rates across 48 states.
- Cross-Chain Discount Architecture: Structured pricing tiers across 90 categories incorporating manufacturer agreements and private label margins delivered an average shopper saving of 13.2% across Walmart, Kroger, and Target combined.
Pricing Intelligence Data Overview
A comprehensive evaluation was conducted to extract and analyze pricing performance indicators across all three retail chains, delivering actionable intelligence for competitive market positioning.
| Intelligence Metric | Walmart | Kroger | Target |
|---|---|---|---|
| Active SKUs Tracked | 58,000+ | 42,000+ | 40,000+ |
| Store Locations Covered | 1,620 | 980 | 740 |
| States with Coverage | 48 | 35 | 43 |
| Daily Records Captured | 1.6M | 1.2M | 1.0M |
| Loyalty Members Analyzed | 1.8M | 1.4M | 1.0M |
| Avg. Discount Rate | 12.4% | 14.1% | 10.8% |
| Price Refresh Rate | 7.2x/day | 5.8x/day | 5.1x/day |
| Private Label Share | 34% | 44% | 36% |
| Seasonal Catalog Variation | 19% | 22% | 23% |
| Stock Availability Rate | 94.1% | 91.7% | 90.3% |
| Weekend Sales Surge | 29% | 24% | 21% |
| Pricing Accuracy Benchmark | 96.2% | 94.8% | 93.5% |
Operational Performance Intelligence
Systematic evaluation of critical pricing performance factors across 90 major retail categories delivered comprehensive insights into pricing pattern behavior spanning 118,000+ product records.
| Efficiency Benchmark | Walmart | Kroger | Target |
|---|---|---|---|
| Processing Speed (records/day) | 1.6M | 1.2M | 1.0M |
| Price Sync Accuracy | 96.2% | 94.8% | 93.5% |
| Inventory Refresh Cycle (x/day) | 7.2x | 5.8x | 5.1x |
| Competitive Index Score | 81.4% | 77.9% | 74.6% |
| Market Penetration Coverage | 72.3% | 63.8% | 61.4% |
Strategic Market Intelligence
1. Pricing Optimization Strategies
- Demand-Responsive Price Tracking: Structured analysis of 90 product categories using behavioral signals from 4.2 million loyalty members drives $3.1 billion in quarterly pricing decisions, guiding assortment adjustments and supplier negotiations with 1,800+ vendor partners across all three retailers.
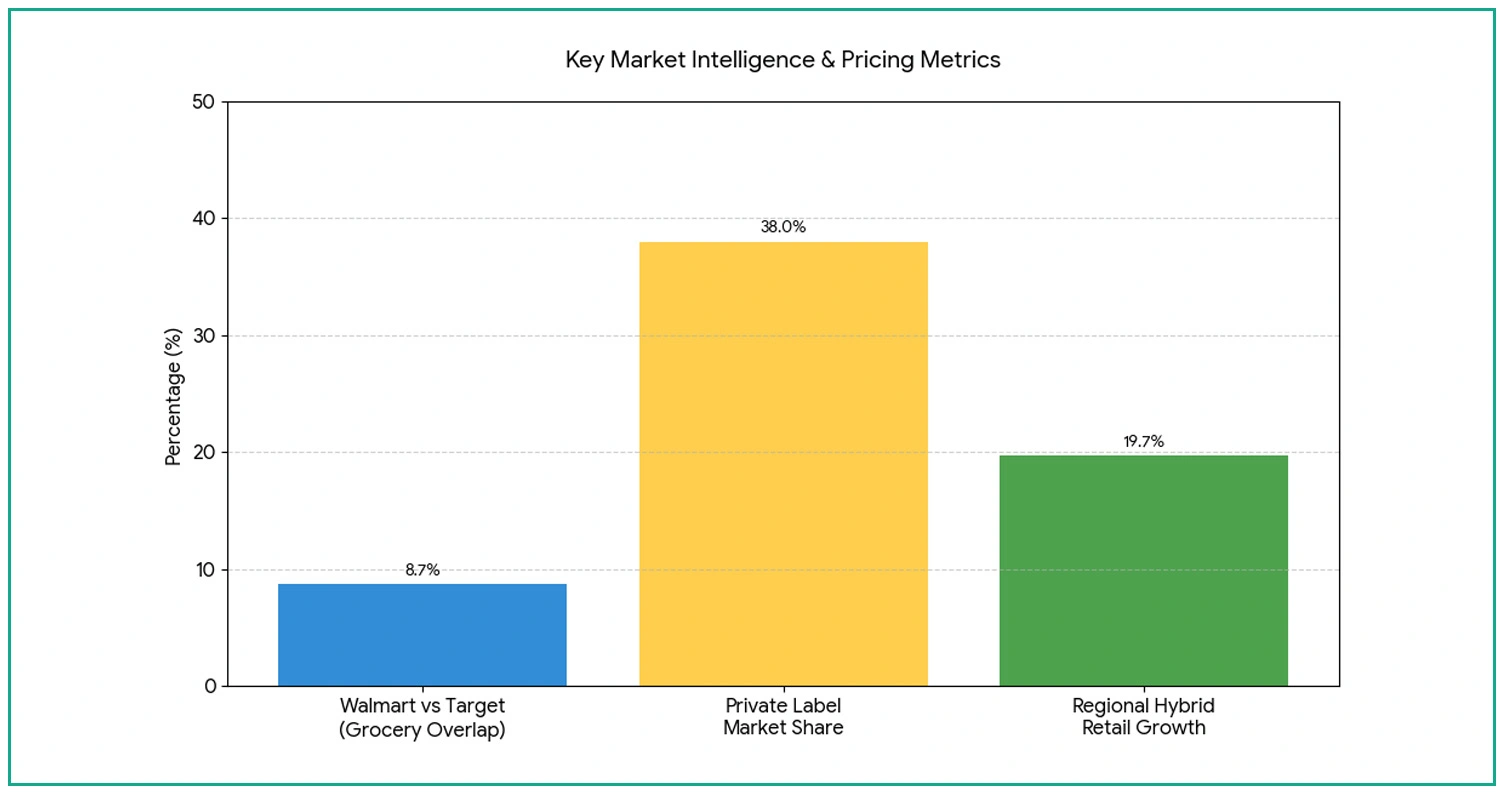
- Real-Time Price Update Monitoring: Pricing Discrepancy Analysis Across Walmart and Target identifies that Walmart prices 8.7% lower than Target across 62% of overlapping grocery SKUs, creating clear strategic repositioning opportunities for competing brands.
2. Market Intelligence Framework
- Regional Pricing Dynamics: As regional grocery chains integrate dynamic pricing technologies, opportunities to Extract Kroger App Data expand, supporting cross-market price intelligence across hybrid retail environments growing at 19.7% annually in 22 key regions.
- Private Label Price Intelligence: Private label lines across all three retailers hold a combined 38% market share, aligning with value-seeking demographics and influencing purchasing decisions among 4.2 million tracked loyalty account holders. Track US Grocery Product Prices With Web Crawlers enables businesses to monitor private label price shifts in near real time across all 90 tracked categories.
Impact of Pricing Data on Retail Market Strategy
Price Comparison Scraping Across US retail networks processes 3.8 million records daily and fundamentally reshapes how businesses approach pricing strategy and competitive intelligence across 90 product categories.
Systematic pricing analysis of 118,000+ products enables businesses to:
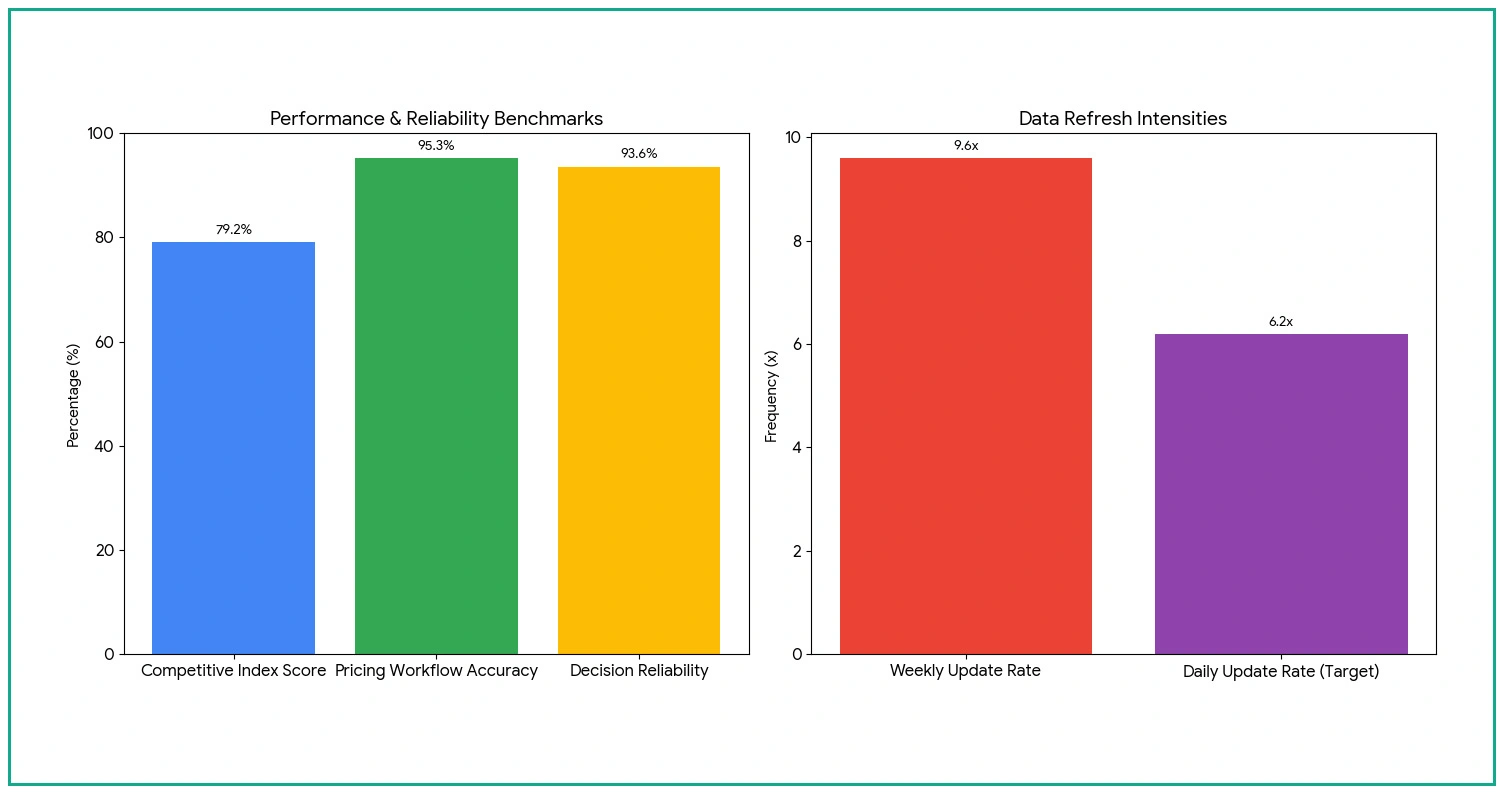
- Identify price gap opportunities by tracking SKU-level variance across 90 segments, achieving 79.2% competitive index scores across 48 targeted U.S. states.
- Forecast promotional cycles by analyzing price drop patterns for 140,000+ SKUs and seasonal fluctuations impacting 21% of the catalog with a 9.6x weekly update rate.
- Improve operational pricing workflows using retail data insights with 95.3% accuracy, informed by 4.2 million loyalty member behavioral patterns across multiple market tiers.
Target Dataset intelligence powered by mobile scraping services supports sustained competitive advantage through high-frequency price monitoring with 6.2x daily updates and category-level strategic insights, ensuring making decisions with a 93.6% reliability benchmark across all three retail chains.
Conclusion
Retail businesses operating in today’s highly competitive environment require accurate and continuous pricing visibility to respond quickly to changing market conditions. Retail Price Monitoring Across Walmart, Kroger & Target helps organizations build a reliable intelligence framework for tracking promotions, benchmarking competitors, and evaluating SKU-level pricing movements across major U.S. retail chains.
Contact Mobile App Scraping to implement customized retail intelligence solutions designed for scalable market analysis and operational efficiency. Our advanced Price Comparison Scraping Across US infrastructure provides near real-time monitoring of more than 140,000 product prices across 48 states, updated up to 6.2 times daily while maintaining 95.3% data accuracy.