How Does Web Scraping Client-Facing Dashboard for Market Research Transform Data into Insights?
Introduction
Modern market research teams collect large volumes of pricing, product, review, competitor, and customer data from websites every day. However, raw datasets alone do not support quick decisions. A well-designed dashboard turns fragmented records into meaningful business intelligence for marketing, product, sales, and strategy teams.
Instead of waiting for analysts to prepare manual reports, decision-makers can review market movements, competitor activity, consumer preferences, and category performance through visual reports that update on a scheduled basis. API Scraping also supports dashboard development by collecting structured information from digital platforms, marketplaces, apps, and web services.
Businesses increasingly use a Web Scraping Client-Facing Dashboard for Market Research to transform raw web information into clear, usable, and measurable insights. It provides clients with direct access to relevant data points, performance indicators, and market trends through a secure and easy-to-navigate reporting interface.
Transforming Raw Information Into Clear Market Views

Market research projects often require data collection from competitor websites, marketplaces, review platforms, product catalogs, and digital content pages. Teams need a structured reporting environment that organizes records into meaningful views, making it easier to review pricing shifts, product availability, customer feedback, content changes, and competitor activities.
A dashboard can convert large datasets into visual reports that support faster interpretation. According to Forrester, organizations that provide accessible analytics tools can improve decision-making speed and strengthen operational performance across business functions.
Content Audit Data Scraping Services can support this reporting process by collecting structured details from competitor pages, including product descriptions, metadata, keywords, content updates, promotional messages, and page-level changes. This information can help businesses compare digital positioning and understand how competitors communicate with their audiences.
| Dashboard Element | Business Value | Example Insight |
|---|---|---|
| Price Tracking Panel | Monitors competitor pricing patterns | Identifies sudden discounts across key categories |
| Product Availability View | Tracks stock and catalog changes | Highlights products removed from competitor websites |
| Review Monitoring Area | Measures customer feedback trends | Shows common complaints and positive themes |
| Content Comparison Report | Evaluates competitor messaging | Detects changes in product descriptions and offers |
| Regional Market Filter | Supports location-based research | Compares demand patterns across different markets |
Using Data Visualization for Web Scraping Results helps transform complex research data into charts, trend lines, comparison tables, heat maps, and performance indicators. These visual formats improve reporting clarity, reduce analysis time, and help clients understand important market signals with greater confidence.
Improving Reporting Speed Through Automated Intelligence
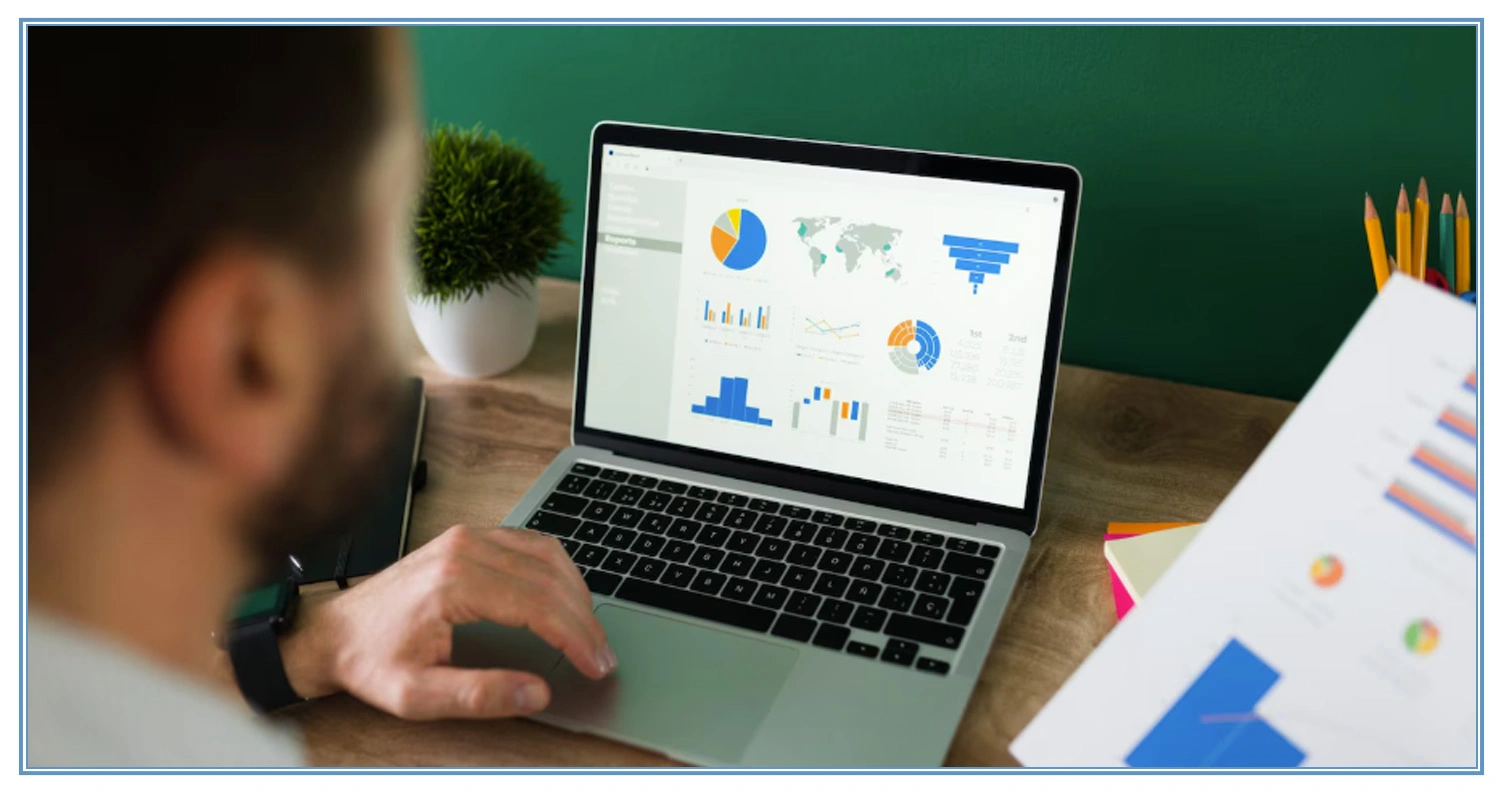
Manual reporting can create major delays for market research teams that manage large volumes of competitor, product, review, pricing, and customer data. This process becomes more difficult when businesses need daily updates, weekly comparisons, or ongoing monitoring across multiple industries and digital channels.
Automated reporting workflows help reduce these challenges by connecting data collection processes with dashboard systems. Once the information is standardized, reports can refresh at scheduled intervals and display updated insights without requiring analysts to rebuild files manually.
A Real-Time Dashboard for Web Scraped Data allows clients to monitor important market changes as they occur. Retail businesses can track price adjustments, travel companies can review availability updates, and consumer brands can observe product launches or promotional changes.
| Automation Feature | Operational Benefit | Research Impact |
|---|---|---|
| Scheduled Data Refresh | Reduces manual update work | Keeps market reports current |
| Automated Data Validation | Identifies missing or incorrect records | Improves reporting accuracy |
| Alert Notifications | Flags important market changes | Supports faster client action |
| Trend Comparison Tools | Measures changes over time | Reveals recurring market patterns |
| Role-Based Dashboard Access | Controls client visibility | Protects sensitive research data |
Web Scraping with AI can improve reporting workflows by classifying records, detecting patterns, summarizing reviews, identifying product attributes, and flagging unusual market activity. When teams Build Interactive Dashboards for Web Scraping Projects, clients can filter results, compare competitors, select time periods, and analyze category-level information independently.
Supporting Enterprise Decisions Through Scalable Reporting

Large organizations require reporting systems that can manage high volumes of market data across multiple brands, product categories, customer groups, regions, and competitors. Simple spreadsheets may not provide enough flexibility for enterprise research needs, especially when leadership teams require consistent updates from several sources.
Research teams can configure dashboard views based on individual client requirements. Retail companies may need daily price comparisons, while travel businesses may require hotel availability, review sentiment, and destination demand tracking. Consumer goods brands may focus on product catalog changes, competitor promotions, and customer feedback.
Web Data Mining helps organizations identify useful patterns from large volumes of collected digital information. When displayed through interactive reporting systems, these findings become easier to compare across time periods, competitors, and locations.
| Enterprise Dashboard Capability | Strategic Benefit | Client Outcome |
|---|---|---|
| Multi-Source Data Integration | Combines information from different platforms | Creates a unified market view |
| Historical Trend Analysis | Tracks long-term market changes | Supports forecasting and planning |
| Competitor Benchmarking | Compares brands across key metrics | Identifies performance gaps |
| Custom KPI Reporting | Aligns reports with client objectives | Improves decision relevance |
| Scalable User Access | Supports multiple teams and regions | Enables wider internal collaboration |
A Web Scraping Analytics Dashboard for Enterprises can support marketing, sales, product, and strategy teams by presenting relevant market intelligence through a shared reporting interface.
How Mobile App Scraping Can Help You?
Mobile applications contain valuable information about product listings, prices, user reviews, service availability, promotions, delivery options, and competitor updates. A well-structured Web Scraping Client-Facing Dashboard for Market Research can combine mobile app data with website data to provide a broader view of digital market activity.
Our approach includes:
- Track product pricing across competing mobile applications
- Monitor app-based discounts and promotional campaigns
- Compare ratings, reviews, and customer feedback trends
- Identify catalog updates and new product introductions
- Review delivery options and service availability changes
- Analyze competitor app features and user experience patterns
Mobile app data can become easier to interpret when businesses use Client-Facing Dashboards via scraping to organize app insights into filters, trend reports, comparison charts, and category-level views.
Conclusion
Businesses can improve market research outcomes when they turn collected web data into visual, accessible, and action-oriented reporting systems. A Web Scraping Client-Facing Dashboard for Market Research helps clients monitor competitor activity, pricing movements, customer feedback, content changes, and market trends through one centralized interface.
With the right data pipeline and Data Visualization for Web Scraping Results, clients can make informed decisions using updated market intelligence rather than relying on outdated spreadsheets. Contact Mobile App Scraping today to build a customized dashboard that turns your scraped data into practical market insights.